|
In 2020, I joined forces with NGO's - Sand Dams Worldwide (SDW) and Africa Sand Dam Foundation (ASDF) to help them answer the question of “how long water from sand dams is lasting throughout the year”. In this short blog post, I am happy to discuss with you our findings and the implications of this study. We’ll be discussing “why we are interested in this question”, “how we researched this question”, and “what we found out”. Firstly though, for those of you not familiar with what a sand dam is, I would like to direct you here for a video, which explains them better than I could, and here to SDW’s website where you can find everything sand dam related you might need to know. 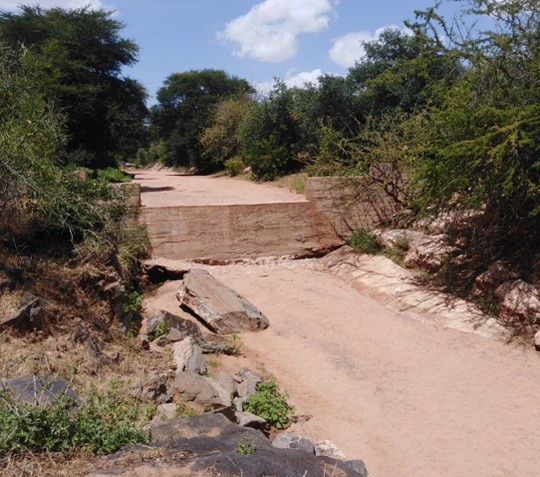 Figure 1: Sand dam Why are we interested (and why you should be too)? So, why do we care about whether sand dams are providing water year-round? There is uncertainty over whether water from sand dams is lasting all the way through the dry season, or whether people can only abstract water from sand dams at the beginning of the dry season, when they have just been replenished by the rains. Because of this conflict in results, we can’t easily conclude how effective sand dams are as a dryland and specifically dry season water source. For example, can people rely on them when other water sources are unavailable (such as when surface waters have run dry)? Or are the dams dry by the second week of the dry season? Answering this question is very important for understanding their level of use, acceptance, and financial viability, helping to inform future water management interventions and to ensure that communities are serviced with a continuous improved supply. Knowing whether there are certain dry season months when sand dams have no water being abstracted can also inform on months when water supply from other sources needs expanding. Finally, knowing which sand dams have more or less water being abstracted can aid in optimising sand dam design. You might be thinking, “but no water abstracted doesn’t necessarily mean no water being available”, and you would be right. Because, whilst abstraction volumes may be linked to storage, many other variables, such as convenience, quality, and the use of other sources can also impact abstraction. Thus, the contribution that sand dams make to water security is not synonymous with the amount of water actually stored in the dam. Therefore, whilst this study can show us abstraction patterns from sand dams and therefore behaviours of use, it cannot confirm for certain whether there is or isn’t any water available. How did we do it? Figure 2: Map of study area - Makueni and Machakos Counties, Kenya Now you know why we’re interested and why it matters, how did we actually go about answering the question: “how long water from sand dams is lasting throughout the year”? In 2019, 26 sand dam hand pumps in Makueni and Machakos Counties, Kenya (see map above) were fitted with Waterpoint Data Transmitters (WDT) by ASDF. These devices measure the number of times and with what force a handpump is used over an hour and convert this into an estimated volume of water abstracted (Thomson et al., 2012). This data point is then transmitted by SMS. I had access to this remotely sensed data from April 2019 until October 2021. With a data point every hour for 26 sites over 31 months, I ended up with a very large data set! This study focusses only on water abstracted from handpumps (improved water source) and does not include the abstraction from scoop holes (unimproved water source), from which a large amount of water is usually obtained, meaning that total water volumes abstracted from the sand dams are likely much higher. 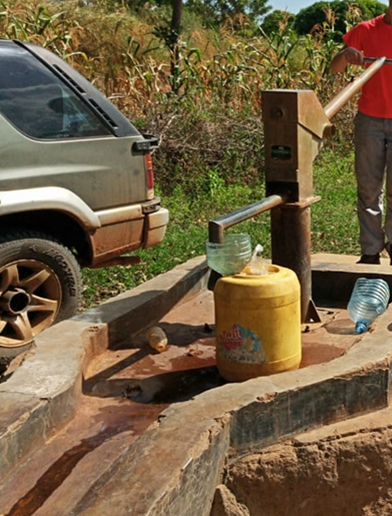 Figure 3: Hand pump Alongside this abstraction data, I also had access to interview and observation data provided by MSc student Joanna Chan, ASDF, and SDW. These variables included perceived salinity, abstraction limits, livestock use, whether the dam is said to have ever run dry, presence of rainwater harvesting tanks, actual salinity (μs/cm), area of dam wall (m2), average distance travelled from home to dam (km), and user numbers (Chan, 2019). This data was then analysed to assess how much water people were abstracting and for how long throughout the year the water continued to be abstracted for. The variables collected from interview and observation were then analysed to provide insight into differences in abstraction between sites. For example, did sites with larger dam walls have more water being abstracted, or did salinity impact abstraction in any way? Finally, we looked specifically at the last week in September (as a proxy for the end of the long dry season) to assess whether enough water to specifically meet drinking water needs (2 L/p/day) was still being abstracted at any sites. Due to the necessity of an improved source of water for drinking (of which a handpump is one), we wanted to know whether the handpumps could independently meet drinking water needs, in case no other water sources were available. What did we find out? After analysing all of the data and wrapping my head around some statistical analysis, I like to think that we found some interesting results. The most obvious finding was that of high variability in abstraction volume between the 26 hand pumps and seasons. We found abstraction to be significantly higher in the long dry season, indicating a high reliance and delivery of water when other sources are compromised. The diagram below shows median monthly abstraction (L/month) (red line) and average monthly rainfall (mm) (brown bars – dry season and blue bars rainy season) across all sites – indicating higher abstraction when rainfall is lower. 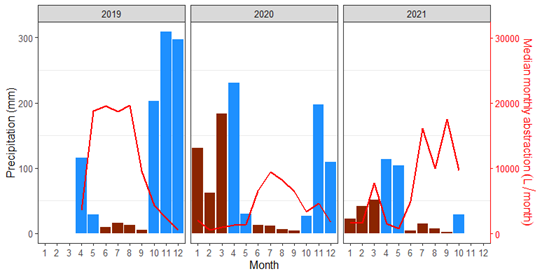 Figure 4: Median monthly abstraction (L/month) (red line) and average monthly rainfall (mm) (brown bars – dry season and blue bars rainy season) across all sites There was abstraction data available from 21 handpumps (81%) by the end of at least one of the analysed long dry seasons, with at least some water still being abstracted. At 59.1% of these sites, enough water to meet each user’s drinking water needs (2 L/p/day) was being abstracted in at least one of the analysed years. This indicates that such dams can meet the drinking water needs of users independently of other sources. Using the variables which were collected in interviews and observations, we found that sites with a greater proportion of people using the water for livestock, higher salinity, and larger dam walls had significantly higher levels of abstraction. This is to be expected as higher salinity sites are often used more for livestock (Chan, 2019), which have a greater water demand than that for drinking, whilst larger dam walls can lead to a greater volume of sand build up and therefore water storage (Maddrell & Neal, 2012). These results highlight sand dams as a sustainable alternative to other dry season sources such as water vendors, which can be expensive and unreliable. However, lower abstraction in certain months and sites highlights that we must approach water management holistically. No one technique is necessarily the answer to dryland water security and all available water sources must be considered. Clearly, not all sand dams behave the same, with certain sand dams always likely to have higher levels of abstraction than others. However, high abstraction and sustained water availability by the end of the long dry season at many sites profess the positive contribution that sand dams can make to a community’s water supply, offering opportunities for further success in the future. Closing remark I really hope you enjoyed learning about abstraction trends from sand dams as much as I enjoyed studying them (most of the time!) If you’re interested in learning more, I hope the paper will be published soon, which will be freely available for everyone to read. If you’d like to reach out, please do! Many thanks for reading. References Chan, J. (2019). Abstraction of Water from Sand Dams in Machakos and Makueni Counties (Kenya) via Handpumps.
Maddrell, S., & Neal, I. (2012). Sand Dams: a Practical Guide. Thomson, P., Hope, R., & Foster, T. (2012). GSM-enabled remote monitoring of rural handpumps: A proof-of-concept study. Journal of Hydroinformatics, 14(4), 829–839. https://doi.org/10.2166/hydro.2012.183
0 Comments
Who knew the contemplation, The hours of organisation, The meetings that would over-run, The somewhat real yet second hand fun. Six months to organise our task, How hard could it really be we asked, Prioritising WaSH and early careers, We hoped there would be minimal tears With nine in the team decisions were hard But the teamwork and passion caught us off guard, Everyone’s enthusiasm kept us afloat, The friendship, the leadership, I wish to note Organising our first conference was not easy, But we succeeded, although not breezy Everything we learnt has been stored We were even decorated with an award  Organisation
In June 2022, the students of the Water WISER Centre for Doctoral Training (CDT) organised the 1st Water WISER Early Career Researcher (ECR) Conference. I was part of a team of nine student who took on this somewhat daunting but educational task. Crossing students from Leeds, Loughborough, and Cranfield, none of the committee had ever organised an academic conference before. With limited input from academics, we had free reign to design and implement an event specifically for ECR in the water and waste sectors. Beginning in December of 2021, roughly seven months stretched ahead of us to organise our conference. Roles and responsibilities were difficult fields to navigate in the initial days, with no clear leadership or direction. Over time, however, we slotted into areas aligned with our interests and abilities and we started to gel well as a team. We found it beneficial to break into smaller working groups for some tasks and to report back to the wider group regularly on our progress. On receipt of many high-quality abstracts from both Water WISER students and external students from national and international universities, we had the privilege of reading them but the difficult decision of prioritising those best aligned to our themes. With abstracts selected, we consolidated our program, logistics planning, and field trip. We also had three posters submitted and an industry networking event to organise. With WaSH being a multidisciplinary sector, we wanted to encourage speakers and participants from a broad range of subjects. Considering ‘WaSH’ in the first instance we decided not to have ‘WaSH’ in our conference title. This decision was made in light of many people working in water, sanitation, waste, health, and hygiene, who wouldn’t necessarily consider themselves to be working in the WaSH sphere. We chose therefore to focus on water and waste instead, striving to make it an inclusive space for everyone in these sectors, encouraging diverse conservations and knowledge exchange. The event Over the two days of the conference at Loughborough University we ran parallel speaker sessions and a poster session. Running speaker sessions on Groundwater, Climate, and Circular Economy together on day one, and Sanitation, Inequalities, and Economics on day two, we were able to include as many speakers as possible in our program. Whilst we tried to put as different themes together as possible to reduce people’s inability to attend their desired theme, this wasn’t always possible, and people inevitably missed talks and themes that they would have liked to attend. To overcome this in some sense we published the abstracts and recordings in our conference repository after the event, but it was still an area of constructive criticism received in feedback. Our sessions incorporated three speaker presentations, followed by a panel discussion / Q&A with the speakers and a room-wide discussion on a chosen topic within each theme. This worked well to involve all participants and to allow for a more natural conversation with the panellists. We also ran a networking session with industry partners and between participants. We felt a dedicated time slot of doing nothing formal was crucial for allowing people to chat casually. Our networking session allowed WSUP, The Sanitation Learning Hub, and Groundwater Relief to showcase their work and to interact with academics. We felt passionate about enabling this interaction as the divide between academia and industry can sometimes be vast. Whilst we would ideally have liked more industry partners present, it was an important interaction to facilitate, giving ECR’s an idea of future opportunities and to discuss novel research projects with those working on the ground. We were very fortunate to welcome four fantastic key note speakers: Rebecca Scott, Richard Carter, Dr. Liz Tilley, Dr. Amita Bhakta, and Dr. Andrew Longley, who spoke passionately of the changes in the WaSH sector over the years, tips and advice for ECR and lessons learnt, the peri-menopause, and working in industry and in the field. We wished to invite a diverse range of speakers, which I believe we succeeded at. The WaSH sector is packed full of diverse researchers, implementers, advocates, and organisations and we wanted to reflect some of this diversity in our event. We also ran two very well received workshops: research communication led by James McKay and inequalities in academia, led by the Water WISER academics inequalities working group (WWAIWG). Highlights of the communication workshop included drawing our research, writing a simplified story of someone else research and role-playing a conversation with a child about why you study what you do. Everybody appreciated James’ enthusiasm and artistic flare in making some of us with less creativity improve our communication skills. The second of our two workshops focussed on positionality and how our identity can impact our research and why this is important. We read two case study papers and used these alongside our personal experiences to discuss questions on researcher demographics, working in unfamiliar contexts and academic inequalities. The session was eye-opening and helped some participants to consider topics they may not have thought relevant to them before. Being intent on fostering a fun and inclusive atmosphere we organised a frisbee session on one of the evenings, which all who attended really enjoyed. Feeling that the atmosphere at conferences is often drinks orientated come the evening we felt strongly about including alternative options. Continuing with our active theme, the final day gave way to our much anticipated fieldtrip to Bradgate Park, in which Dr Andrew Longley led us on an excellent tour of the geological and palaeontological history of the local area, followed by a much needed rest at the local pub! Welcoming over 75 participants, the feedback received was exceptionally positive. The conference was praised on being an academic yet informal and safe space to share ideas, network, and to learn. It was praised on being inclusive, informative, and enjoyable. The conference committee were exhausted but thrilled and proud to have pulled off such a feat, although couldn’t have done it without the help of volunteers, the CDT management team, and Loughborough staff. We’re looking forward to handing over the baton and seeing what the next group of willing committee members will devise in future years. If, on the off chance, you are reading this as a first time WaSH / water / engineering conference organiser and would like to reach out, please do. As a committee, we would always be more than happy to share more of our experiences. Hannah Post by: Hannah RitchieSummary
Non-Governmental Organisations (NGOs) play a dominant role in the humanitarian and development sectors, providing emergency relief and delivering specific programmes, such as education, improved water, sanitation and hygiene, and human rights support. NGOs were born out of the failing approach of state-led development in the 1970s and 1980s to meet the needs of the world’s poorest (3). International Non-Governmental Organisations (INGOs) extend this concept of the NGO to an international scope, usually operating from headquarters outside of the countries in which they are working (3). We might like to think of INGOs as altruistic organisations. However, despite what anyone may tell you, can any organisation ever be truly altruistic? After all - INGOs rely on dependency to survive. As such, is the system of aid and development in which INGOs operate, along with the way they’re run, perpetuating a cycle of dependency, alongside an inherent inequality between race, location and class? In this blog, I will discuss just that, delving into the work of INGOs in an inherently unjust system that fosters corruption and weak markets, whilst safeguarding the interests of donor countries.  Image from devpolicy.org
Post by: Sophie Budge What?! I'm not small! It's the world that's too big! - Hiromu Arakawa A persistent and pressing issue, malnutrition is a key public health issue facing the globe. Of that fact, epidemiologists, nutritionists, public health specialists, economists, politicians and academics have no doubt. Stunting, a chronic form of malnutrition (or more precisely, undernutrition, although that itself is contentious [1]), is essentially a category of linear growth failure – ‘failure’ in comparison to a global reference standard of optimal child growth [2]. To be ‘stunted’ is to belong in the bracket of a HAZ score (height-for-age) <–2 SD below this global reference. And that’s so agreeable – an efficient, tidy measure which affords some order in a world overwhelmed with linking exposures to outcomes and outcomes to numbers. HAZ <–2 SD can be used to describe point prevalence and time trends of stunted children, both within and across populations, and at local, national and global levels. It’s used to a point which seems an infectious obsession (a key insight by the intrepid Lawrence Haddad). But what really does it mean for a child to be ‘stunted’? And why this obsession? And interventions which focus on stunting as an outcome − what exactly are they (we) trying to solve? 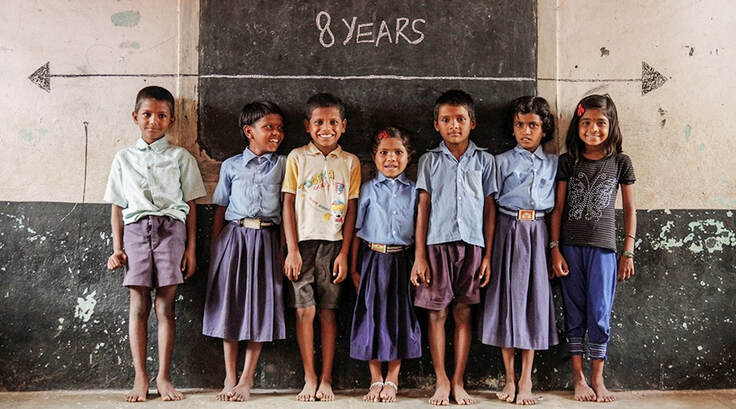 Seven eight-year-old children stand in front of a wall with the line depicting the average height according to the WHO Child Growth Standards [3].
|
