|
In 2020, I joined forces with NGO's - Sand Dams Worldwide (SDW) and Africa Sand Dam Foundation (ASDF) to help them answer the question of “how long water from sand dams is lasting throughout the year”. In this short blog post, I am happy to discuss with you our findings and the implications of this study. We’ll be discussing “why we are interested in this question”, “how we researched this question”, and “what we found out”. Firstly though, for those of you not familiar with what a sand dam is, I would like to direct you here for a video, which explains them better than I could, and here to SDW’s website where you can find everything sand dam related you might need to know. 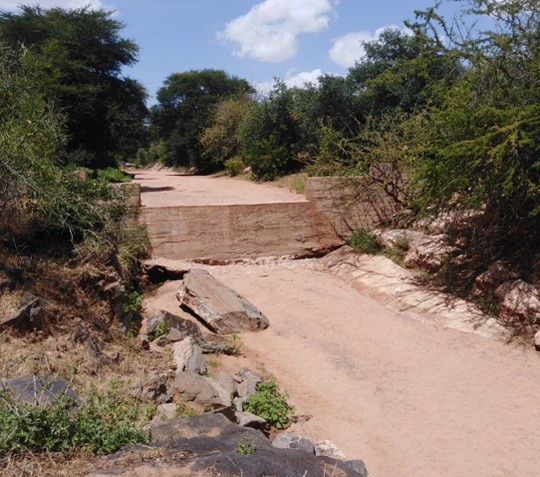 Figure 1: Sand dam Why are we interested (and why you should be too)? So, why do we care about whether sand dams are providing water year-round? There is uncertainty over whether water from sand dams is lasting all the way through the dry season, or whether people can only abstract water from sand dams at the beginning of the dry season, when they have just been replenished by the rains. Because of this conflict in results, we can’t easily conclude how effective sand dams are as a dryland and specifically dry season water source. For example, can people rely on them when other water sources are unavailable (such as when surface waters have run dry)? Or are the dams dry by the second week of the dry season? Answering this question is very important for understanding their level of use, acceptance, and financial viability, helping to inform future water management interventions and to ensure that communities are serviced with a continuous improved supply. Knowing whether there are certain dry season months when sand dams have no water being abstracted can also inform on months when water supply from other sources needs expanding. Finally, knowing which sand dams have more or less water being abstracted can aid in optimising sand dam design. You might be thinking, “but no water abstracted doesn’t necessarily mean no water being available”, and you would be right. Because, whilst abstraction volumes may be linked to storage, many other variables, such as convenience, quality, and the use of other sources can also impact abstraction. Thus, the contribution that sand dams make to water security is not synonymous with the amount of water actually stored in the dam. Therefore, whilst this study can show us abstraction patterns from sand dams and therefore behaviours of use, it cannot confirm for certain whether there is or isn’t any water available. How did we do it? Figure 2: Map of study area - Makueni and Machakos Counties, Kenya Now you know why we’re interested and why it matters, how did we actually go about answering the question: “how long water from sand dams is lasting throughout the year”? In 2019, 26 sand dam hand pumps in Makueni and Machakos Counties, Kenya (see map above) were fitted with Waterpoint Data Transmitters (WDT) by ASDF. These devices measure the number of times and with what force a handpump is used over an hour and convert this into an estimated volume of water abstracted (Thomson et al., 2012). This data point is then transmitted by SMS. I had access to this remotely sensed data from April 2019 until October 2021. With a data point every hour for 26 sites over 31 months, I ended up with a very large data set! This study focusses only on water abstracted from handpumps (improved water source) and does not include the abstraction from scoop holes (unimproved water source), from which a large amount of water is usually obtained, meaning that total water volumes abstracted from the sand dams are likely much higher. 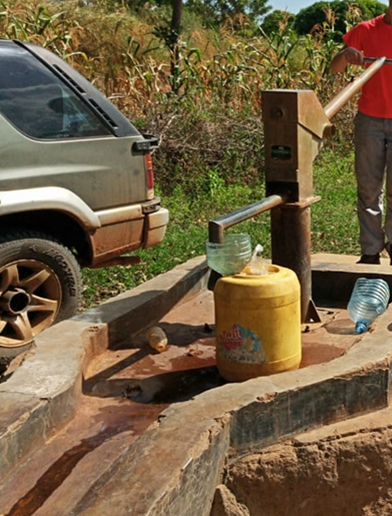 Figure 3: Hand pump Alongside this abstraction data, I also had access to interview and observation data provided by MSc student Joanna Chan, ASDF, and SDW. These variables included perceived salinity, abstraction limits, livestock use, whether the dam is said to have ever run dry, presence of rainwater harvesting tanks, actual salinity (μs/cm), area of dam wall (m2), average distance travelled from home to dam (km), and user numbers (Chan, 2019). This data was then analysed to assess how much water people were abstracting and for how long throughout the year the water continued to be abstracted for. The variables collected from interview and observation were then analysed to provide insight into differences in abstraction between sites. For example, did sites with larger dam walls have more water being abstracted, or did salinity impact abstraction in any way? Finally, we looked specifically at the last week in September (as a proxy for the end of the long dry season) to assess whether enough water to specifically meet drinking water needs (2 L/p/day) was still being abstracted at any sites. Due to the necessity of an improved source of water for drinking (of which a handpump is one), we wanted to know whether the handpumps could independently meet drinking water needs, in case no other water sources were available. What did we find out? After analysing all of the data and wrapping my head around some statistical analysis, I like to think that we found some interesting results. The most obvious finding was that of high variability in abstraction volume between the 26 hand pumps and seasons. We found abstraction to be significantly higher in the long dry season, indicating a high reliance and delivery of water when other sources are compromised. The diagram below shows median monthly abstraction (L/month) (red line) and average monthly rainfall (mm) (brown bars – dry season and blue bars rainy season) across all sites – indicating higher abstraction when rainfall is lower. 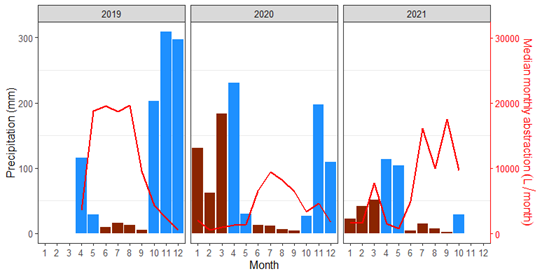 Figure 4: Median monthly abstraction (L/month) (red line) and average monthly rainfall (mm) (brown bars – dry season and blue bars rainy season) across all sites There was abstraction data available from 21 handpumps (81%) by the end of at least one of the analysed long dry seasons, with at least some water still being abstracted. At 59.1% of these sites, enough water to meet each user’s drinking water needs (2 L/p/day) was being abstracted in at least one of the analysed years. This indicates that such dams can meet the drinking water needs of users independently of other sources. Using the variables which were collected in interviews and observations, we found that sites with a greater proportion of people using the water for livestock, higher salinity, and larger dam walls had significantly higher levels of abstraction. This is to be expected as higher salinity sites are often used more for livestock (Chan, 2019), which have a greater water demand than that for drinking, whilst larger dam walls can lead to a greater volume of sand build up and therefore water storage (Maddrell & Neal, 2012). These results highlight sand dams as a sustainable alternative to other dry season sources such as water vendors, which can be expensive and unreliable. However, lower abstraction in certain months and sites highlights that we must approach water management holistically. No one technique is necessarily the answer to dryland water security and all available water sources must be considered. Clearly, not all sand dams behave the same, with certain sand dams always likely to have higher levels of abstraction than others. However, high abstraction and sustained water availability by the end of the long dry season at many sites profess the positive contribution that sand dams can make to a community’s water supply, offering opportunities for further success in the future. Closing remark I really hope you enjoyed learning about abstraction trends from sand dams as much as I enjoyed studying them (most of the time!) If you’re interested in learning more, I hope the paper will be published soon, which will be freely available for everyone to read. If you’d like to reach out, please do! Many thanks for reading. References Chan, J. (2019). Abstraction of Water from Sand Dams in Machakos and Makueni Counties (Kenya) via Handpumps.
Maddrell, S., & Neal, I. (2012). Sand Dams: a Practical Guide. Thomson, P., Hope, R., & Foster, T. (2012). GSM-enabled remote monitoring of rural handpumps: A proof-of-concept study. Journal of Hydroinformatics, 14(4), 829–839. https://doi.org/10.2166/hydro.2012.183
0 Comments
|
