 Post by: Adrian Mallory My favourite thing about the above image is that there is no evidence that Vladimir Lenin ever said this. Trying to find the original source only drags you down into a rabbit hole of right-wing vitriol. But it goes to show that eventually once something has been repeated enough people come to believe it, and the origin of the story becomes lost. My life goal is now to get this re-attributed to Lil Wayne. The French philosopher Lil Wayne (fine, Jean Baudrillard), wrote a book about this phenomenon where in fact most of what we deal with is a copy of a copy of a copy and the original is lost: simulacra and simulation [1]. It can seem quite an abstract concept, but can have dangerous ramifications when we accept a repeated lie (or untruth, to be generous) as gospel. One of the most pertinent examples is where, by repetition and media coverage, intelligence that was suspected to have been copied from a Nicholas Cage movie turned into a ‘Credible source’ with ‘Silver-bullet intelligence’ about weapons of mass destruction in Iraq [2]. But what does this mean for WASH researchers? How often when we are looking at statistics or information do we think about the original form of data and how it was collected? To answer this question we’ll go to Kibera, Nairobi where I’m currently researching. First we look at one of the most effective abstractions that has changed modern life: Google maps. Google maps has explored and mapped the world to such an effective extent that now when I use it in Kenya and find a dead end where there shouldn’t be, I’m angry at the road for not being where my phone told me it was. My phone isn’t wrong, the road is! Yet for so long this densely populated (more on this later) slum was a blank space in Google maps. It didn’t exist. This speaks to the political reality of the lack of recognition and attention paid to such areas. From its very inception, colonial town planning was specifically designed to ensure that Nairobi was not a place for Kenyans (they used the word 'native' but it makes me queasy) and ‘workers housing’ areas were only to allow the temporary supply of labour. To this day there is still little legal recognition − it is classed as government land, and the lack of acknowledgement of the inhabitants can be mirrored in the lack of visibility on maps. 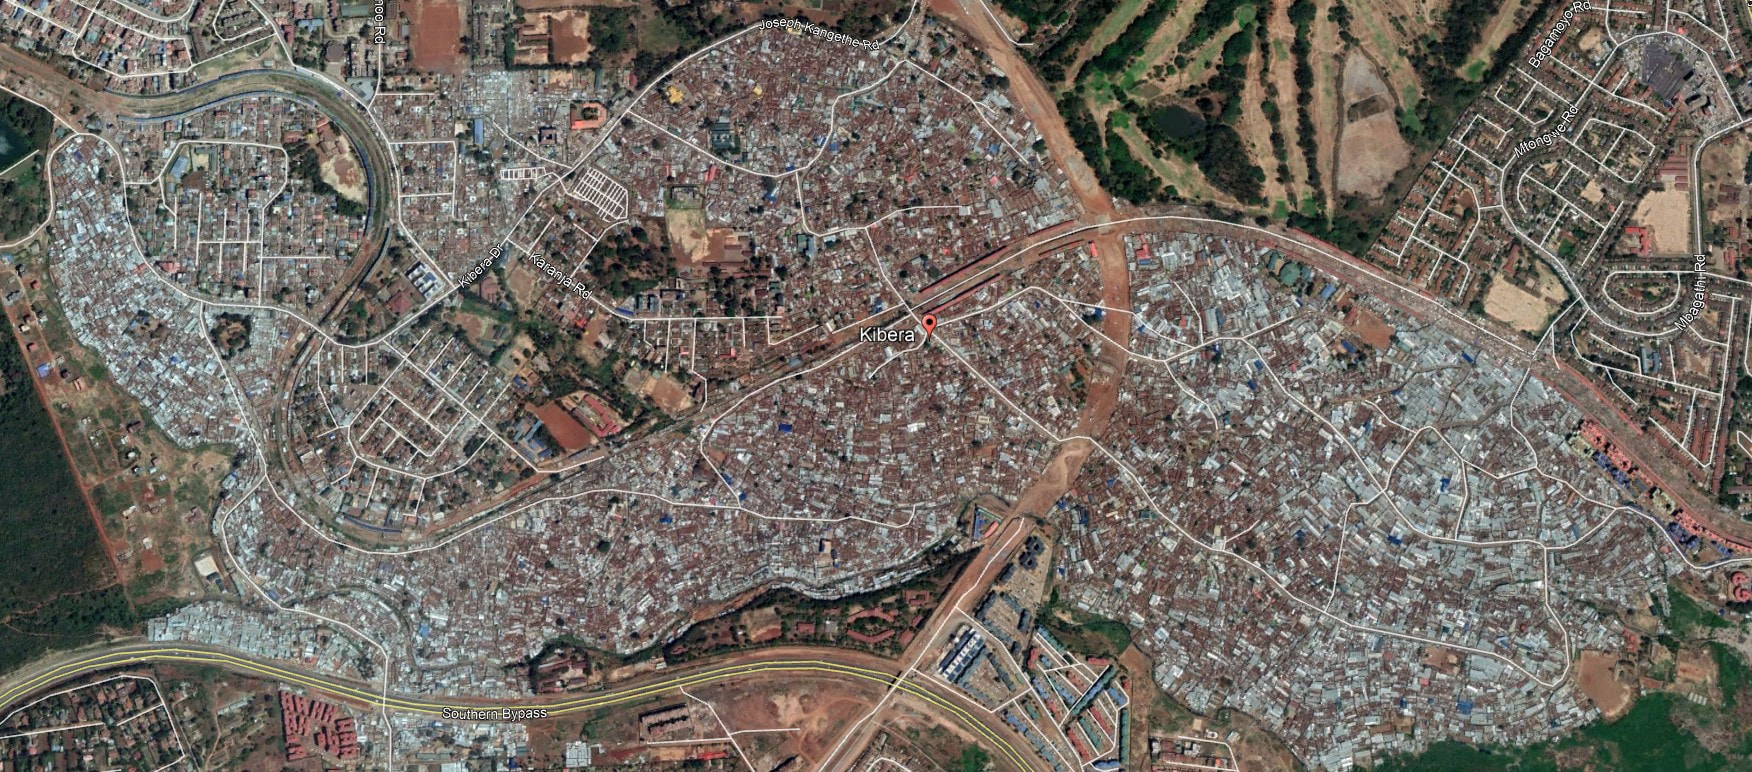 Figure 1: Satellite Imagery of Kibera, Nairobi (© Google 2018 Image © 2019 Maxar Technologies) Thanks to MapKibera, a project that used smartphones and OpenStreetMap to map the area, this city within a city is there for all to see. Roads, security, churches, paths. They are all now mapped and navigable. Issues of transporting faecal sludge along paths and roads can now be modelled using this open-source data. Service points could be planned more effectively. But in a system where inhabitants still lack land tenure, many things remain uncertain. 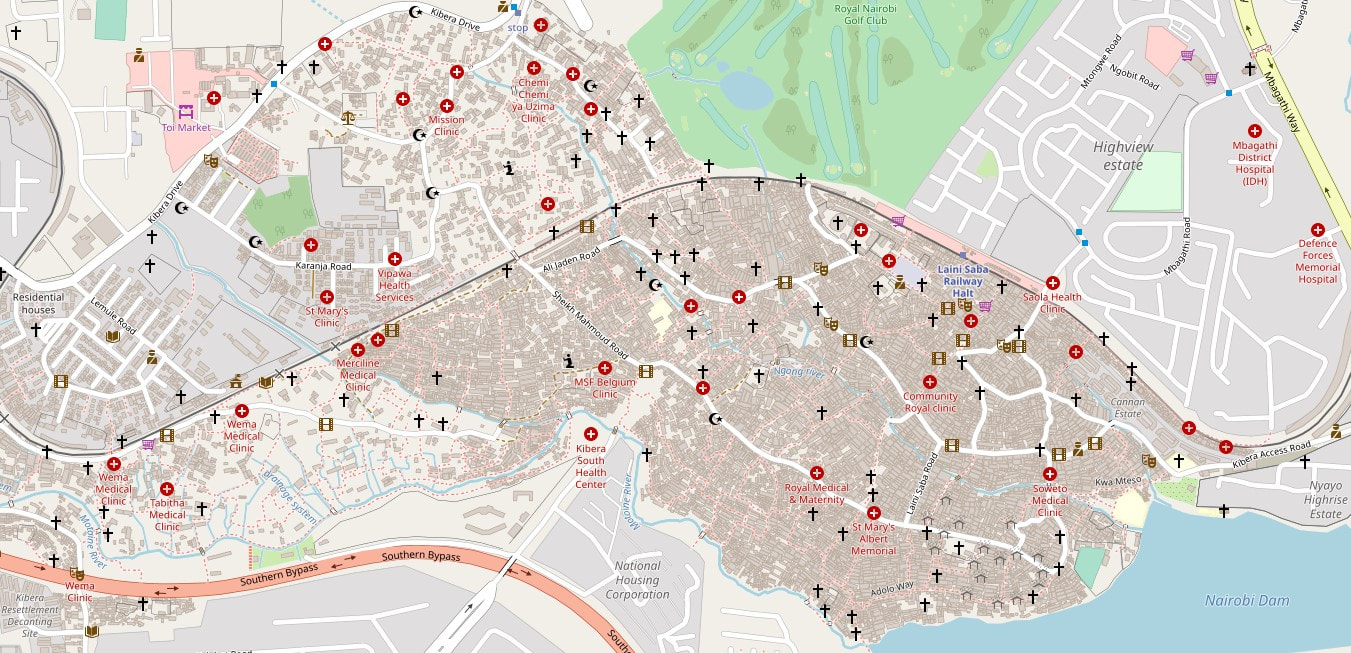 Figure 2: Map of Kibera After Open Source Citizen Based Mapping (© OpenStreetMap contributors) ,If you want to provide sanitation services, have a place to treat waste and to provide water, then one of the first questions you’d want to know is “For how many people?”. Here, the data is as murky as the river passing through Kibera. For years a common range of 1 to 2 million was cited, making Kibera ‘The largest slum in Africa’ [3−5]. A claim that I have also repeated at a TEDx talk, so my factual error is there for all to see. This figure is still often repeated when speaking to NGOs or projects working here – but where does it come from? Is there any original reality underlying this repeated stat? In 2009 when the government census was last conducted, a population of 170,000 was found. Later studies found the population to be closer to 250,000. So the 1–2 million is a 300-700% overestimate! Whilst all this uncertainty can seem, frankly, ridiculous and unsettling, the scarier truth is that this uncertainty can be profitable. In my TEDx talk I was trying to show the power of citizen-led mapping, and putting millions of people on the map is surely a more powerful story. Did I latch on to the statistics that embellished my narrative? Organisations looking to mobilise funding for development projects also have a much more powerful narrative if they adopt the ‘biggest slum in East Africa' motif and can claim to be accessing millions of people. The political value of uncertain statistics was most clearly observed in Malawi by Morten Jerven [6]. Malawi has, for a long time, provided a counter to the usual IMF and World Bank model of removing subsidies for fertiliser. This has been held up as a success both in academic and popular literature, most pertinently by Jeffrey Sachs, a huge proponent of subsidies for development [7,8]. The success of the policy even led to a softening of the world bank’s stance on subsidies, and was believed to be instrumental in Peter Mutharika being re-elected in 2009 [7]. After the election, census data looking at agriculture was released, which estimated that rather than the official 3.4 million tonnes per year of Maize figure cited by the Ministry of Agriculture, the figure was closer to 2 million. The fact that this census was done in 2006 but the data not released until after the 2009 election was contentious in itself. The two figures used similar methods, deriving an average yield and multiplying it by the number of farmers operating. Both methods agreed on a similar average yield, but the Ministry of Agriculture had nearly 1 million more farmers in the country producing food. Most striking was the lack of willingness to try and resolve this discrepancy between different government departments [7]. The political gain of this uncertainty again had 2 functions: the ministry was capable of showing the success of its fertiliser subsidy programme and by overestimating the number of farmers, the number of vouchers and funding accessed could be increased and traded for political support. There is a suggestion that farmers were ‘invented’ which meant that households could access and sell multiple vouchers [6]. The cost of the program was much larger than expected in the election year of 2009, suggesting the use of uncertainty and voucher funding to buy political support. Whilst no evidence of tampering was provided, Malawi is currently in a constitutional crisis after a court decision declared the most recent election results (another victory for Peter Mutharika) null and void over suspected tampering including the infamous use of Tipp-ex [9]. Pointing out this statistical illiteracy is not new, and Hans Rosling was the biggest advocate of Factfulness, only holding beliefs where there is clear evidence for the fact behind it [10]. Arguably, and it hurts me to say this about a hero, he is also one of the largest proponents of misleading statistics, as he opens his book with the fact that the proportion of people in poverty has halved between 1990 and 2015. This refers to the success of the Millennium Development Goal 1. Later in the book when detailing an argument, Hans Rosling defends one of his points because the information is from the UN, which seems to put it beyond reproach. But Jason Hickel points out many issues with how the goal on poverty was measured [11]: Firstly, the figure of a dollar a day was simply chosen, and has no evidence of being the rate of income where people suddenly are more comfortable in living; secondly, whilst the goals were agreed in 2000, the benchmark was 1990. How many people do you know who say ‘I’m going to go on a diet, starting last year?’ This backdating allowed for the rapid income growth in China during the 90s to become part of the story of the Millennium Development Goals. Further, one of the biggest shifts when achieving this mass reduction of poverty came in 2008 when the poverty line was redefined at $1.25, and suddenly an additional 121 million people had been lifted from poverty. Arguably, the misleading information around poverty conveys a political legitimacy to the current economic and development system when in fact it is not improving livelihoods [11]. I spent so much of my twenties reading books, listening to development theory and lectures on ‘the best ways to alleviate poverty’. After bouncing back and forth over ideologies of aid, investment, infrastructure and democracy, it seems the easiest answer as the best way to alleviate poverty is to redefine it. The reason I point this all out is in the hope that the next time you’re writing an introduction to a paper, or a proposal, using headline statistics about poverty and sanitation, you remember: statistics are not gospel. They are copies of copies of copies, and often their production can serve a political purpose that we should be wary of. As Lil Wayne once said: Healthy scepticism is the basis of all accurate observation. Dr Adrian Mallory is a Post-Doctoral Research Fellow at Cranfield University. His research focuses on issues of circular economy, particularly in sanitation and agriculture, across sub-Saharan Africa. He is on Twitter, and you can watch his Tedx talk here. 1. J. Baudrillard. Simulacra and Simulation. University of Michigan Press 1994: Ann Arbor, Michigan.
2. P. Walker. "The Rock movie plot ‘may have inspired MI6 source’s Iraqi weapons claim'". The Guardian, 6 July 2016. 3. M. Robbins. "The missing millions of Kibera". The Guardian, 1 August 2012. 4. A. Tomasini. Audio Slideshow: Dr Biden Sees the Neighborhoods of Kenya. The White House Blog, June 8 2010. 5. A. S. Erulkar and J. K. Matheka. Adolescence in the Kibera Slums of Nairobi, Kenya. Nairobi, The Population Council, Nairobi, Kenya, 2007. 6. M. Jerven. The political economy of agricultural statistics and input subsidies: Evidence from India, Nigeria and Malawi. Journal of Agrarian Change 2014, 14:(1): 129–145. 7. B. Chinsinga, The Political Economy of Agricultural Policy Processes in Malawi : A Case Study of the Fertilizer Programme Subsidy. Future Agricultures 2012, working paper 039. 8. J. D. Sachs. "How Malawi Fed Its Own People". New York Times, 19 April 2012. 9. S. Chitete, “Malawi top court annuls presidential election results”. Al Jazeera, 3 February 2020. 10. H. Rosling, Factfulness. Flaitron Books 2018; New York. 11. J. Hickel. “The true extent of global poverty and hunger: questioning the good news narrative of the Millennium Development Goals,” Third World Quarterly 2016, 37,(5): 749–767.
0 Comments
Leave a Reply. |
